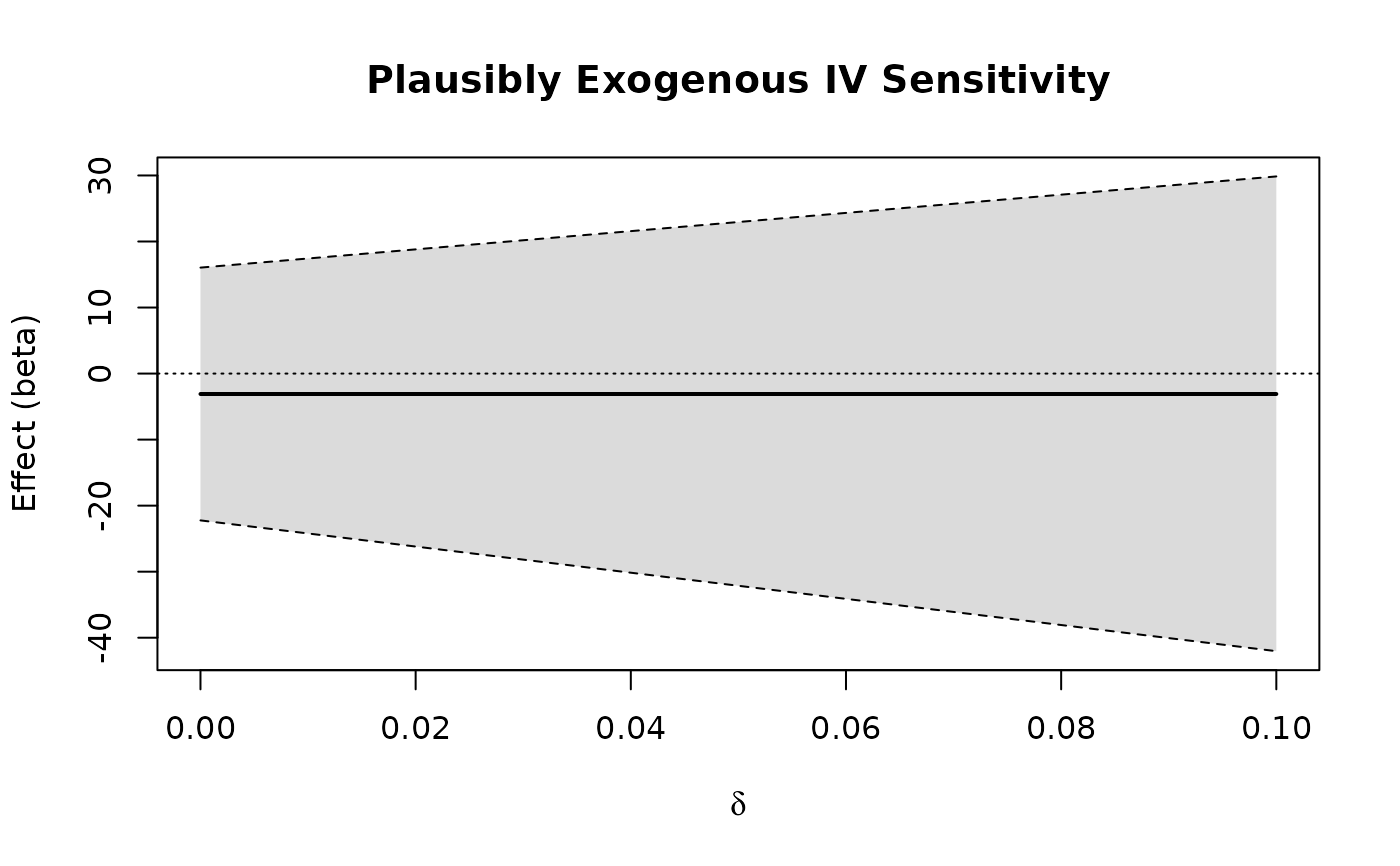
Plot Patterned Sensitivity Output or a Fitted Object
Usage
plot_sp_sensitivity(
  df_plot,
  term = NULL,
  ylab = "Effect (beta)",
  main = "Plausibly Exogenous IV Sensitivity",
  ...
)
Arguments
- df_plot
Data frame returned by a sensitivity helper or a
spliv_fitobject.- term
Optional term to plot when
df_plotis a sensitivity-path object. If omitted, the first term is plotted (with a warning for multiple terms).- ylab
Y-axis label.
- main
Plot title.
- ...
Additional graphics arguments forwarded to the sensitivity-path plotting method; ignored for fitted objects and ordinary data frames.
Examples
set.seed(7)
d <- data.frame(y = rnorm(80), x = rnorm(80), z = rnorm(80))
p <- spliv_sensitivity_path(y ~ x | z, d, method = "uci", delta_grid = c(0, 0.1))
plot_sp_sensitivity(p, term = "x")